

When studying the charts above, please keep in mind the following constraints that have been implemented in the code:
- There are no healthcare, retirement, vacation, and entertaining categories since the dataset does not have related information.
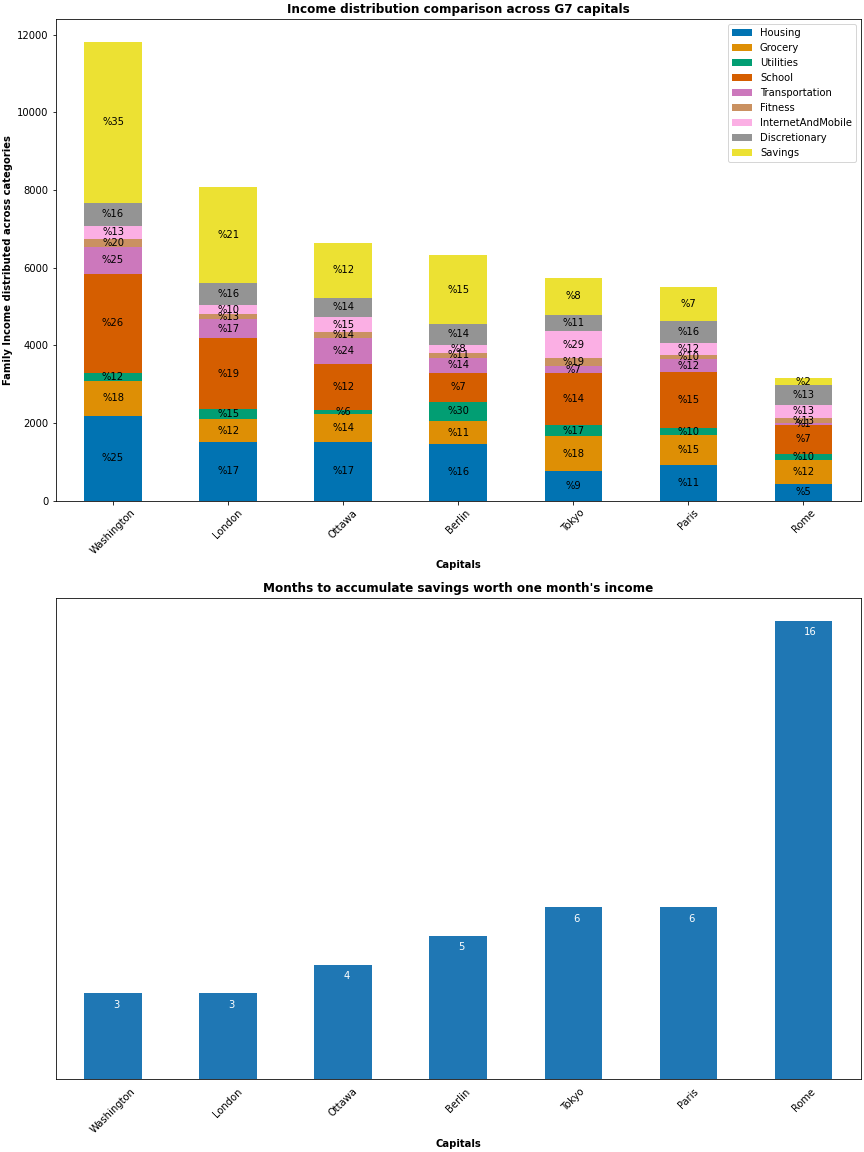
- The charts assume a family of two earning parents and one child that goes to the international school since a bigger family would have meant no savings in some of the countries considered.
- Rome, Italy option assumes no car ownership and the percentage of income for housing is set to 25% for Italy and 28% for other countries. This was done to ensure > 0 savings for Rome.
Why I wrote this post
Python has powerful data analysis and charting feature via the pandas and matplotlib libraries as any data science professional will attest. I wanted to target this post primarily to developers who are not yet into machine learning and want to strengthen their data analysis skills in python. I have used a public domain dataset: Global Cost of Living from kaggle. to generate the charts.
The python concepts covered by the code in this post:
Setting up the Jupyter notebook development environment in your machine
Jupyter notebook is a great interactive environment to learn/develop python code and also to export content for publishing to websites and blogs. Yes, we can develop code in traditional Python IDE as well. But getting familiar with Jupyter in your local machine first will allow for an easy transition to data science cloud platforms like kaggle.
To setup Jupyter notebook on your local machine see:
Once you open the Jupyter notebook in your machine you can copy the code that follows below into the cells and run them. In the code below:
- '%run dataAnalysis.ipynb' is referring to a 2nd notebook. You need to copy content from dataAnalytics.ipynb into a file named dataAnalysis.ipynb and save it in the appropriate location in your local environment.
- You will need to uncomment the pip install statements in the first cell of dataAnalysis.ipynb and run it in the notebook to ensure that all dependencies are installed. You can comment them after you install the dependencies.
- You will need to copy Global Cost of Living from kaggle onto your local environment.
Hope this post was useful to you. You can leave your comments in the Enter comments here.. box at end of this page and hit Submit Reply.
from iteround import saferound
import matplotlib.pyplot as plt
import seaborn as sns

%run dataAnalysis.ipynb

dataAnalysis = DataAnalysis('cost-of-living_v2.csv')
dataAnalysis.ShowG7CountriesComparison()
dataAnalysis.ipynb
import pandas as pd
import numpy as np

#!pip install matplotlib
#!pip install seaborn
#!pip install mortgage
#!pip install iteround

#!pip install ipympl

# If using JupyterLab 2
#!pip install nodejs
#!jupyter labextension install @jupyter-widgets/jupyterlab-manager
#!jupyter labextension install jupyter-matplotlib
from mortgage import Loan
from iteround import saferound

## For capital city in each of the World's biggest 6 economies by GDP
### Distribute Avg monthly net salary for a family of 2 adults, 1 school going kid (assume private Intl. primary school ):
#### 1. Apartment mortgage outside of center
#### 2. Groceries
#### 3. Utilities
#### 4. Transportation
#### 5. Healthcare
#### 6. Schooling
#### 7. Misc. Goods & Services
#### 8. Auto insurance
#### 9. Home insurance
#### 10. Savings
#### Depict the above in a stacked bar chart
#### Depict comparison of savings potential across the G7 capitals in a bar chart.
class DataAnalysis:

    # dictionary with G7 countries and their capitals
    capitals_G7 = [('United States','Washington'),('Japan','Tokyo'), ('Germany','Berlin'),
               ('France','Paris'), ('United Kingdom','London'),
               ('Italy','Rome'), ('Canada','Ottawa')]

    # map the column names
    MealInexpensive = 'x1'
    Meal2People = 'x2'
    McMeal = 'x3'
    BeerDomesticRestaurant = 'x4'
    BeerImportedRestaurant = 'x5'
    Cappucino = 'x6'
    Coke = 'x7'
    Water = 'x8'
    Milk = 'x9'
    Bread = 'x10'
    Rice = 'x11'
    Eggs = 'x12'
    Cheese = 'x13'
    Chicken = 'x14'
    Beef = 'x15'
    Apples = 'x16'
    Banana = 'x17'
    Oranges = 'x18'
    Tomato = 'x19'
    Potato = 'x20'
    Onion = 'x21'
    Lettuce = 'x22'
    Water = 'x23'
    Wine = 'x24'
    BeerDomesticMarket = 'x25'
    BeerImportedMarket = 'x26'
    Cigarettes = 'x27'
    LocalTransport1Way = 'x28'
    MonthlyPass = 'x29'
    TaxiStart = 'x30'
    Taxi1km = 'x31'
    Taxi1hrWaiting = 'x32'
    Gasoline = 'x33'
    CarVolkswagenGolf = 'x34'
    CarToyotaCorolla = 'x35'
    Utility = 'x36'
    PrepaidMobile = 'x37'
    InternetAndMobile = 'x38'
    FitnessClub = 'x39'
    TennisCourtRent = 'x40'
    Cinema = 'x41'
    Preschool = 'x42'
    PrimarySchool = 'x43'
    Jeans = 'x44'
    SummerDress = 'x45'
    NikeRunningShoes = 'x46'
    LeatherBusinessShoes = 'x47'
    Apt1BedroomCityCtr = 'x48'
    Apt1BedroomNoCityCtr = 'x49'
    Apt3BedroomCityCtr = 'x50'
    Apt3BedroomNoCityCtr = 'x51'
    PricePerSqMtCityCtr = 'x52'
    PricePerSqMtNoCityCtr = 'x53'
    AvgMonthlyNetSalary = 'x54'
    MortgageInterest = 'x55'
    df = None
    dfForStackedbar = None

    # constructor
    def __init__(self, csvFile):
        self.df = pd.read_csv(csvFile)
        self.df.set_index(['country','city'], inplace=True)

    # computer monthly grocery. The logic is based on Google searches
    # of healthy serving sizes. The divisors below like 1000 and 500 are based
    # on the data disctionary documentation.
    # All computations are based on metric system (serving sizes are in grams, milliliters)
    def MonthlyGrocery(self, country, city, familySize):
        cupSizeInLiters = 0.24
        daysInMonth = 30.42  # 365 distributed equally into 12 months
        milkServingSize = 3 * cupSizeInLiters
        breadServingSize = 0.86 # 6 slices per week
        riceServingSize = 0.66
        cheeseServingSize = 40
        chickenServingSize = 105
        beefServingSize = 85
        applesServingSize = 54
        orangesServingSize = 152
        bananasServingSize = 250
        tomatoesServingSize = 75
        potatoesServingSize = 173
        onionsServingSize = 150
        lettuceServingSize = 75
        wineServingSize = 20/daysInMonth
        beerServingSize = 1.4/daysInMonth

        # (item, divisor): (servingSize, # of persons)
        dictItemsServings = {(self.Milk, 1.0): (milkServingSize,familySize), (self.Bread, 500): (breadServingSize,familySize),
                     (self.Rice, 1000): (riceServingSize,familySize),(self.Cheese,1000): (cheeseServingSize, familySize), (self.Chicken,1000): (chickenServingSize,familySize),
                     (self.Beef,1000) : (beefServingSize,familySize),(self.Apples, 1000): (applesServingSize,familySize), (self.Oranges,1000): (orangesServingSize, familySize),
                     (self.Banana,1000): (bananasServingSize, familySize),(self.Tomato,1000): (tomatoesServingSize, familySize),(self.Potato,1000): (potatoesServingSize, familySize),
                     (self.Onion,1000): (onionsServingSize, familySize),(self.Lettuce,680): (lettuceServingSize, familySize),# 1 head lettuce = ~ 680gms
                     (self.Water,1): (1, familySize),(self.Wine,25): (wineServingSize, 2),(self.BeerDomesticMarket, 0.5):(beerServingSize, 2)}

        # list comprehenion with compute for each grocery item
        groceryItemCostList = [self.df.loc[(country, city),k[0]]/k[1] * v[0] * v[1] for k,v in dictItemsServings.items()]

        return np.sum(groceryItemCostList) * daysInMonth

    # Utilities - Electricity, Heating, Cooling, Water, Garbage
    def Utilities(self, country, city, homeSizeInSqMt):
        basic = self.df.loc[(country, city), self.Utility]/85 * homeSizeInSqMt
        return basic

    def InternetAccess(self, country, city):
        return self.df.loc[(country, city), self.InternetAndMobile]

    def Mobile(self, country, city, numAdults):
        daysInMonth = 30.42  # 365 distributed equally into 12 months
        return self.df.loc[(country, city), self.PrepaidMobile] * numAdults * 25 * daysInMonth

    # Assume fitness club for adults. Tennis 2 hrs/week only for kids. Assume Fitness club includes tennis/games for adults
    def Fitness(self, country, city, adults, kids):
        fitnessClub = self.df.loc[(country,city), self.FitnessClub] * adults
        tennis = self.df.loc[(country,city), self.TennisCourtRent] * 2 * kids

        return (fitnessClub + tennis)

    # only consider cinema every weekas entertainment since that is the only data available
    def Entertainment(self, country, city, familySize):
        movieTickets = self.df.loc[(country, city), self.Cinema] * familySize * 4
        # McMeal is the stand-in for coke popcorn etc
        snacks = self.df.loc[(country, city), self.McMeal] * familySize * 4
        return movieTickets + snacks

    def EatingOut(self, country, city, adults, kids):
        # assume eating out once/month + McMeal once/week
        restaurant = self.df.loc[(country, city), self.Meal2People] * (adults + kids) / 2
        MacMeal = self.df.loc[(country, city), self.McMeal] * (adults + kids)
        beverage =  self.df.loc[(country, city), self.Cappucino] * adults
        drinksAdults = (self.df.loc[(country, city), self.BeerDomesticRestaurant] +
                        self.df.loc[(country, city), self.BeerImportedRestaurant])/2 * adults
        drinksKids = self.df.loc[(country, city), self.Coke] * kids

        return (restaurant + drinksAdults + drinksKids) + (beverage + MacMeal) * 4

    # assume kids go to International school
    def School (self, country, city, kids):
        return self.df.loc[(country, city), self.PrimarySchool] * kids / 12

    # will compute both owning and rent to ensure no more than 28% of income
    def Housing(self,country,city,earningAdults,kids,durationYears=20):
        size3BedroomSqMt = 140
        size2BedroomSqMt = 105
        size1BedroomSqMt = 70

        housingOptions = [(True,self.PricePerSqMtCityCtr, size3BedroomSqMt ), (True, self.PricePerSqMtNoCityCtr,size3BedroomSqMt),
                          (True,self.PricePerSqMtCityCtr, size2BedroomSqMt ), (True, self.PricePerSqMtNoCityCtr,size2BedroomSqMt),
                          (False,self.Apt3BedroomCityCtr, None), (False, self.Apt3BedroomNoCityCtr, None),
                          (True,self.PricePerSqMtCityCtr, size1BedroomSqMt ), (True, self.PricePerSqMtNoCityCtr,size1BedroomSqMt),
                          (False, self.Apt1BedroomCityCtr, None),(False, self.Apt1BedroomNoCityCtr, None)]

        percentageOfIncomeForHousing = 0.25 if (country == 'Italy') else 0.28

        # since the dataset only has the expensive international school option, take school expense out of
        # income before computing housing
        maxPortionOfIncomeForHousing = (self.df.loc[(country,city),self.AvgMonthlyNetSalary] * earningAdults - \
                                        self.School(country, city, kids)) * percentageOfIncomeForHousing

        #print('Max for housing:{}'.format(maxPortionOfIncomeForHousing))
        rent = True
        bedrooms = 1

        for own,opt,size in housingOptions:
            if own:
                price = self.df.loc[(country,city),opt]
                sqMt = size
                loanAmount = sqMt*price
                rate = self.df.loc[(country,city),self.MortgageInterest]/100
                loan = Loan(principal=loanAmount, interest = rate, term=durationYears*12)
                payment = float(loan.schedule(1).payment)
                bedrooms = 3 if size == size3BedroomSqMt else 2 if size == size2BedroomSqMt else 1
                rent = False
                #print('Mortgage payment:{} for {} bedrooms'.format(payment, bedrooms))
            else:
                payment = float(self.df.loc[(country,city),opt])
                bedrooms = 3 if opt == self.Apt3BedroomCityCtr else 1
                rent = True
                #print('Rent:{} for {} bedrooms'.format(payment, bedrooms))

            if (payment < maxPortionOfIncomeForHousing):
                    break;

        return payment, rent, bedrooms

    def CarLoan(self, country, city):
        loanAmount = self.df.loc[(country,city),self.CarVolkswagenGolf] if self.df.loc[(country,city),self.CarVolkswagenGolf] < \
        self.df.loc[(country,city),self.CarToyotaCorolla] else self.df.loc[(country,city),self.CarToyotaCorolla]

        # assume auto loan rate = mortgage rate + 1%
        rate = (self.df.loc[(country,city),self.MortgageInterest] + 1)/100
        loan = Loan(principal=loanAmount, interest = rate, term=5*12)
        payment = loan.schedule(1).payment
        #print((loanAmount, payment))
        return float(payment)

    # https://www.odyssee-mure.eu/publications/efficiency-by-sector/transport/distance-travelled-by-car.html
    def Transportation(self,country,city, familySize):
        kmsPerLiter = 11
        carsKms = {'United States': (2,19600), 'Canada': (2, 17000), 'United Kingdom': (1, 11800),
                  'France': (1, 12200), 'Germany':(1,13600), 'Italy':(0,8500) , 'Japan': (1,6730)}
        carLoan = 0.0
        gasolineExpense = 0.0
        monthlyPass = self.df.loc[(country,city), self.MonthlyPass]
        #print(monthlyPass)

        if (carsKms.get(country) != None):
            carLoan = carsKms[country][0] * self.CarLoan(country,city)
            #print(carLoan)
            pricePerLiter = self.df.loc[(country,city), self.Gasoline]
            #print(pricePerLiter)
            pricePerKm = pricePerLiter/kmsPerLiter
            #print(pricePerKm)
            gasolineExpense = pricePerKm * (carsKms[country][0] * carsKms[country][1])/12
            #print(gasolineExpense)
        else:
            monthlyPass *= familySize # in non car owning countries assume each family member will need pass

        return (monthlyPass + carLoan + gasolineExpense)

    # this includes new clothes in summer and winter, new shoes once/year, sports- once/year
    def ClothingAndShoes(self,country, city, adults, kids):
        familySize = adults+kids
        items = [self.LeatherBusinessShoes,self.NikeRunningShoes,self.Jeans,self.SummerDress]

        # list comprehenion
        itemsList = [self.df.loc[(country, city), item] for item in items]

        return np.sum(itemsList) / 12

    def Compute(self):
        # construct the template for spending categories as a dictionary
        dictForStackedbar = {'country': [item[0] for item in self.capitals_G7], 'city': [item[1] for item in self.capitals_G7],\
                   'Income': [0] * 7,'Housing': [0] * 7,'Rented':[True] * 7, 'Bedrooms': [1] * 7, 'Grocery': [0] * 7,'Utilities': [0] * 7,\
                   'School': [0] * 7,'Transportation': [0] * 7,'Fitness':[0] * 7,'InternetAndMobile':[0] * 7, \
                   'Discretionary': [0] * 7, 'Savings': [0] * 7}

        homeSizes = {1: 70, 2: 105, 3: 140} # bedrooms:home size in SqMt

        # create dataframe from dictionary
        self.dfForStackedbar = pd.DataFrame(dictForStackedbar)
        self.dfForStackedbar.set_index(['country', 'city'], inplace=True)

        # populate each of the columns with values
        for country, city in self.dfForStackedbar.index:
            totalIncome = self.df.loc[(country, city), self.AvgMonthlyNetSalary] * 2
            self.dfForStackedbar.loc[(country, city),'Income'] = totalIncome # both parents earning

            payment, rented, bedrooms = self.Housing(country,city,2,1)
            self.dfForStackedbar.loc[(country, city),'Housing'] = payment

            self.dfForStackedbar.loc[(country, city),'Rented'] = rented
            self.dfForStackedbar.loc[(country, city),'Bedrooms'] = bedrooms

            monthlyGrocery = self.MonthlyGrocery(country, city, 3)
            self.dfForStackedbar.loc[(country, city),'Grocery'] = monthlyGrocery

            utilities = self.Utilities(country, city, homeSizes[bedrooms])
            self.dfForStackedbar.loc[(country, city),'Utilities'] =utilities

            school =  self.School(country, city, 1)
            self.dfForStackedbar.loc[(country, city), 'School'] = school

            internetAccess = self.InternetAccess(country, city)
            mobile =  self.Mobile(country, city,2)
            self.dfForStackedbar.loc[(country, city), 'InternetAndMobile'] = internetAccess + mobile

            transportation = self.Transportation(country, city,3)
            self.dfForStackedbar.loc[(country, city), 'Transportation'] = transportation

            fitness =  self.Fitness(country, city,2,1)
            self.dfForStackedbar.loc[(country, city), 'Fitness'] = fitness

            discretionary = self.Entertainment(country, city,3) + self.EatingOut(country, city,2,1) + self.ClothingAndShoes(country, city,2,1)
            self.dfForStackedbar.loc[(country, city), 'Discretionary'] = discretionary

            self.dfForStackedbar.loc[(country, city), 'Savings'] = 0

        # create a filter for excluding unnecessary columns for savings computation
        filterMask = (self.dfForStackedbar.columns != 'Income') & (self.dfForStackedbar.columns != 'Rented') & (self.dfForStackedbar.columns != 'Bedrooms')

        # from the income substract all items except 'Income', 'Rented' and 'Bedrooms'
        self.dfForStackedbar['Savings'] = [self.dfForStackedbar.loc[(country, city),'Income'] - \
                                        np.sum(self.dfForStackedbar.loc[(country, city),filterMask]) \
                                        for country, city in self.dfForStackedbar.index]

        #print(self.dfForStackedbar)

    def ShowG7CountriesComparison(self):

        # prepare the data for presentation
        self.Compute()

        # sort by income Descending
        self.dfForStackedbar.sort_values(by='Income', ascending=False, inplace=True)
        # create dataset from a dictionary with Months as the only column. This is
        # display the 2nd chart
        dictForSavingsAccum = {'Months': [0] * 7}
        dfSavingsAccum = pd.DataFrame(dictForSavingsAccum)

        # simple division to figure out the months needed to accumulate savings=1 month's income
        months =  np.round(self.dfForStackedbar['Income'] / self.dfForStackedbar['Savings'])

        #list comprehension to create the values for the months column
        months = [int(m) for m in months]
        dfSavingsAccum['Months'] = months
        dfSavingsAccum.sort_values(by='Months', inplace=True)

        # create 2 subplots: 2,1 means 2 rows and 1 column. constrained_layout=True allows for spacing
        # between the 2 subplots
        fig, axs = plt.subplots(2, 1,
                       constrained_layout = True)

        # remove columns not related to spending
        dfPlot = self.dfForStackedbar.drop(['Income','Rented','Bedrooms'], axis=1)
        #define Seaborn color palette to use.
        colors = sns.color_palette('colorblind')[0:len(dfPlot.columns)]

        # plot the stacked barchart
        ax = dfPlot.plot(kind='bar', ax=axs[0],figsize=(12,16), stacked=True,color=colors,xlabel='Capitals')

        # output the % in each of individual segments of each bar
        for c in ax.containers:
            totalIncome = np.sum([v.get_height() for v in c])
            pct = saferound([v.get_height()/totalIncome*100 for v in c], places=0)
            ax.bar_label(c, labels=['%{}'.format(int(p)) for p in pct],label_type='center')

        ax.set_title('Income distribution comparison across G7 capitals',fontweight='bold')
        ax.set_ylabel('Family Income distributed across categories',fontweight='bold');
        ax.set_xlabel('Capitals',fontweight='bold');

        # make the x axis label display at 45 degree angle
        xticklabels = ax.set_xticklabels([city for country,city in dfPlot.index],rotation=45)

        # now plot the histogram about savings

        ax = dfSavingsAccum.plot(kind='bar',ax=axs[1],figsize=(12,16))

        ax.set_title("Months to accumulate savings worth one month's income",fontweight='bold')
        ax.set_xlabel('Capitals',fontweight='bold')
        ax.set_xticks(range(0,len(dfPlot.index)))
        xticklabels = ax.set_xticklabels([city for country,city in dfPlot.index], rotation=45)

        # turn of the ticks to have a minimal chart since values on top of each bar will suffice
        ax.tick_params(axis='x', which='both', bottom=False, top=False)
        ax.tick_params(axis='y', which='both', left=False, right=False, labelleft=False)

        # remove the legend since it provides no additional information
        ax.get_legend().remove()

        #iterate over bars and output the height of the bar at appropriate location on top
        for container in ax.containers:
            for i, child in enumerate(container.get_children()):
                monthsToSave = dfSavingsAccum['Months'].tolist()
                plt.text((child.get_x() + child.get_width()/2), child.get_height() -0.5,str(monthsToSave[i]), color='white')

        # save to jpg
        plt.savefig("g7Comparison.png")